Week 3 · By Andrew Dunn · Data retrieved September 23, 2026
Texas players have 93% of Texas State's receiving yards
Players with Texas hometowns account for 604 of the Bobcats' 648 receiving yards through Week 3 of 2026.
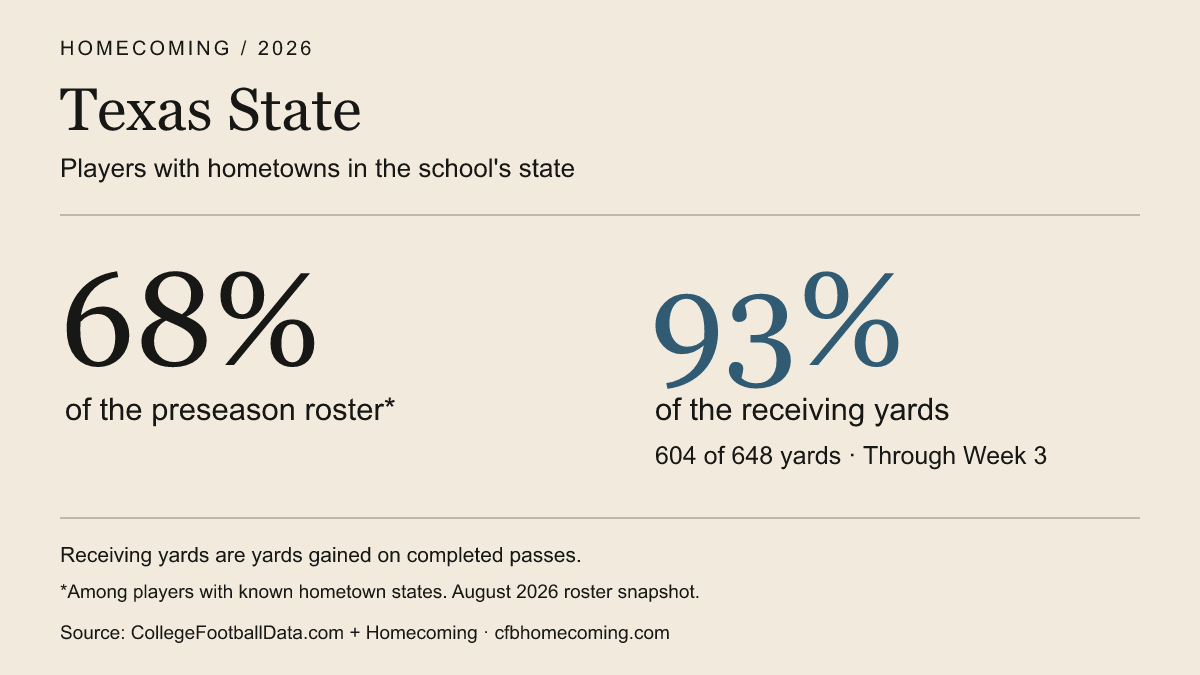
Texas State already had a heavily Texas roster. Before the season, 68% of its players listed a hometown in the state. Those players have 93% of its receiving yards so far.
I built Homecoming to see where college football rosters come from. Now I want to follow how those rosters play. This first report joins the preseason roster data to results through Week 3.
The Texas State number measures one part of the offense. It doesn't count what blockers, defenders, or the rest of the team contributed.
More in-state players, similar records
I ranked teams by the percentage of their preseason roster from the school's state, then compared the 34 teams at the high end with the 34 at the low end.
Against other FBS teams, the highest level of college football, the high-in-state group won 51% of its games. The low-in-state group won 48%.
These are the teams' combined records. I kept games against FCS opponents separate because teams don't play equal numbers of those matchups.
Transfers and distance
I made the same comparison for transfers and hometown distance. Each group below has 34 teams. All records count games against FBS opponents. Score difference is points scored minus points allowed, averaged across those games.
Players from the school's state
- Highest share
- 51% of 82 games wonScore difference: +0.1 points
- Lowest share
- 48% of 73 games wonScore difference: -1.1 points
Players found at another college in an earlier season
- Highest share
- 46% of 80 games wonScore difference: -3.0 points
- Lowest share
- 52% of 77 games wonScore difference: -0.8 points
Typical hometown distance from campus
- Farthest away
- 52% of 71 games wonScore difference: +0.3 points
- Closest
- 42% of 78 games wonScore difference: -1.9 points
Download the full comparison chart
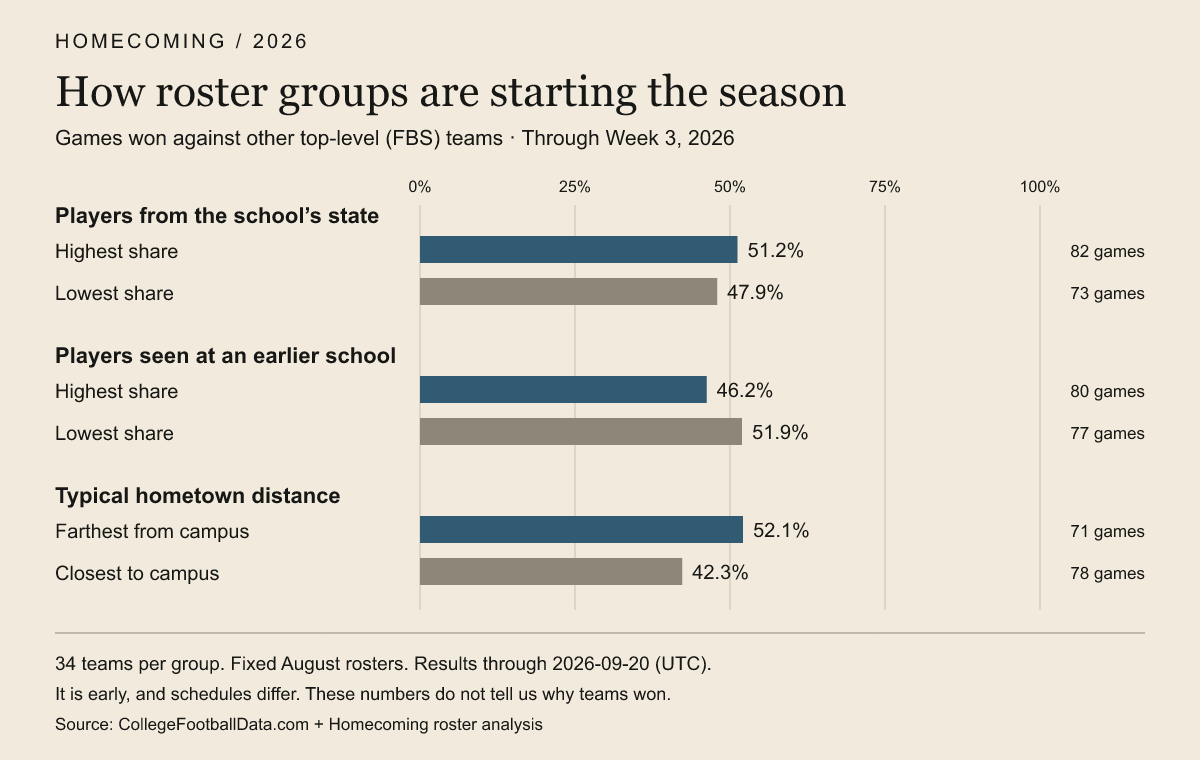
It's early, and these groups have different players, coaches, and schedules. The numbers don't tell us that recruiting locally, recruiting farther away, or using transfers caused a team to win or lose.
Geography and transfers also describe different things. A transfer can come from the school's own state. A player from across the country can stay at one college for years.
What I'm counting
“In-state” means the player's listed hometown is in the school's state. It doesn't necessarily mean they were born there or went to high school there.
For transfers, I look for the same player on another college's roster in an earlier season. That includes players who transferred in previous years and stayed. Missing earlier records can hide a transfer, so this isn't a complete transfer list.
“Typical hometown distance” is the middle distance after sorting players from nearest to farthest. That's the median, measured in a straight line to campus.
The August rosters and comparison groups stay fixed. Each new edition adds game results. That lets us follow the same groups as the season develops.
Sources and checks
This edition includes 260 completed games involving FBS teams. 157 were between two FBS teams. The last completed games were dated September 20 UTC. Data was retrieved September 23, 2026.
Game results and player statistics come from CollegeFootballData.com, joined to Homecoming's August 2026 roster snapshot. All 138 team records match CFBD's separate records table. Texas State's receiving total also matches its game box scores.
In-state roster shares count players with known hometown states. Teams need at least 70 roster entries and known states for at least 75% of the roster. Hometown distance also needs coordinates for at least 75%.
Player statistics are matched by player ID and team. Unmatched hometowns stay unknown. A yardage breakdown needs at least 95% coverage for both geography and transfer history. All of Texas State's receiving yards could be matched.
For rushing, losses count as positive amounts when checking how much yardage can be matched. This stops negative yards from making coverage look better. Receiving, rushing, and passing totals stay separate.
The groups use the highest and lowest quarters of the roster rankings. Teams tied at a cutoff stay together. A game between two teams in one group counts in both teams' records.
See the full roster methodology for source limits and missing history.
Follow Texas State's roster history or browse the 2026 reports.